01
Bookings Flow In
Every reservation, rental, and event logs its own data automatically.
See utilization, revenue, and event settlements at a glance — and turn booking data into decisions that improve your facility.
Every booking in VenueArc becomes a data point. VenueArc turns those points into ready-to-run reports — no exports, no pivot tables, no manual reconciliation. Whether you're prepping for a board meeting or closing out an event, the numbers are already there.
Book a DemoFrom booking to report
Every reservation, rental, and event logs its own data automatically.
Utilization, revenue, and settlement reports stay current in real time.
Pull a CSV, PDF, or on-screen view whenever you need it.
Occupancy by room, time of day, and day of week
Rental income, fees, and outstanding balances by date range
Revenue, expenses, deposits, and fees reconciled in minutes
Weekly and monthly activity, ready for board reports
Utilization and revenue, side by side, across locations
CSV or PDF, for board decks, grants, and audits
Built for every stakeholder
Spot underused spaces and adjust scheduling before it becomes a cost problem
Reconcile settlements and revenue without manual spreadsheet work
Get export-ready summaries without asking staff to build them
See It In Action
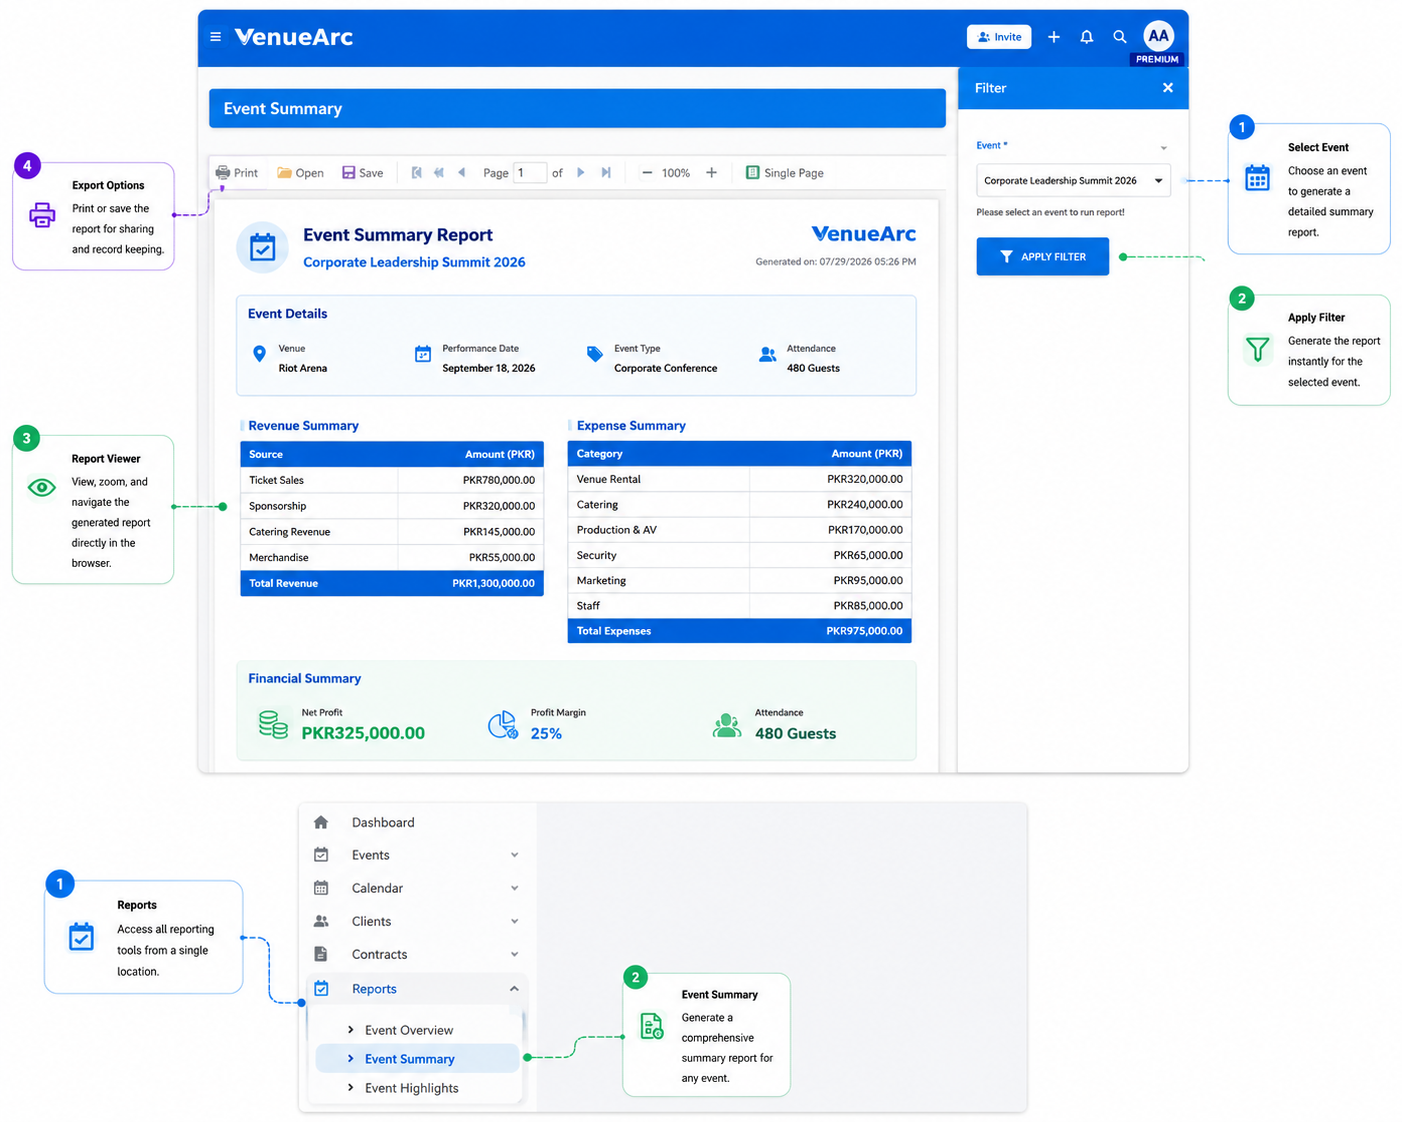
See how VenueArc transforms the way you manage bookings compared to traditional methods.
VenueArc saves time, reduces errors, and gives your team complete control.
Yes. Reports reflect booking data as it's entered, so figures stay current without manual refreshes, rebuilds, or an overnight sync.
This matters more than it sounds. When reporting runs on an exported copy of your data, every number carries a hidden question — how old is this? Teams end up hedging in meetings because nobody is quite sure whether a figure includes last week's bookings. Decisions get deferred to the next reporting cycle.
Because VenueArc reports read directly from the same records your team is already updating, confirming a booking or logging a payment changes the numbers immediately. You can open a utilization report mid-conversation during a board meeting and trust what's on screen, rather than promising to circulate updated figures afterwards.
Yes — revenue and utilization reports can be run across any date range you choose, not just fixed monthly or quarterly presets.
Flexible ranges matter because the periods that count for your organization rarely line up with the calendar. The reporting windows teams actually need tend to be things like:
Being able to set the window directly means you are not exporting to a spreadsheet just to filter rows into the shape you needed in the first place, which is where most reporting time quietly disappears.
Reports export to CSV or PDF, which covers the two quite different jobs reporting usually has to do.
PDF is the presentation format. It preserves the layout, so it works for board packets, grant applications, and audit documentation where the file needs to be read as-is by someone outside your team and filed as a record.
CSV is the working format. It opens in Excel or Google Sheets and feeds into whatever analysis, pivot table, or finance system you already run — useful when someone needs to merge venue figures with budget data that lives elsewhere.
The practical result is that you rarely have to rebuild a report by hand. You pull the range you need, then choose whether the output is going to a person or another system.
Yes. Recurring reports can be set up to generate on a weekly or monthly cadence, so they're ready before anyone has to ask for them.
Scheduling changes who does the chasing. In most organizations, reporting is reactive — a director asks how last month looked, someone spends an afternoon assembling figures, and the answer arrives days after the question. The reporting itself becomes a recurring interruption rather than a routine.
With a standing schedule, the monthly utilization summary or revenue breakdown is simply waiting when the meeting comes around. That has a second effect worth noting: because the same report arrives on the same cadence, you start seeing trends across periods instead of isolated snapshots, which is where most of the useful insight actually lives.
Both. Campus comparison is built specifically for multi-site organizations, but utilization, revenue, and settlement reporting apply exactly the same way to a single facility.
A single-site organization gets the full picture of how its spaces are performing — which rooms are booked solid, which sit empty on weekday afternoons, what recurring bookings are worth over a season, and how event settlements are tracking. None of that depends on having a second location to compare against.
What multi-site adds is the comparative layer: the same metrics side by side across campuses, so you can see whether one location is running near capacity while another has room to spare. Organizations that begin with one site and later add a second do not need to change how they report — the comparison view simply becomes available.
Report access follows the same role-based permissions as the rest of VenueArc, so you control who sees financial data versus scheduling data.
This distinction is usually the important one. The people who need to know whether the main hall is free on Saturday are rarely the same people who should see revenue by client, outstanding settlements, or what a particular renter was charged. In spreadsheet-based reporting these end up in the same workbook, and access becomes all-or-nothing.
Because permissions are set by role, a coordinator can be given everything they need to manage the calendar without financial figures appearing at all, while a finance lead or director sees the full revenue picture. Adding a new staff member is then a matter of assigning the right role, rather than deciding case by case which files to share.
Book a 30-minute demo and see how VenueArc reports work for your organization.
Book a Demo